Global Forest Watch’s 2025 Tree Cover Loss Data Explained
New tree cover loss data from WRI and the University of Maryland’s GLAD lab (UMD), available on Global Forest Watch (GFW), shows that humid tropical primary forest loss slowed in 2025, though progress was uneven across the tropics. How do these findings compare to other estimates of deforestation? Here is what you should know about the new data.
What does tree cover loss measure?
To compare findings from the tree cover loss data to other estimates, it’s important to understand what the tree cover loss data measures, and how this differs from other monitoring systems.
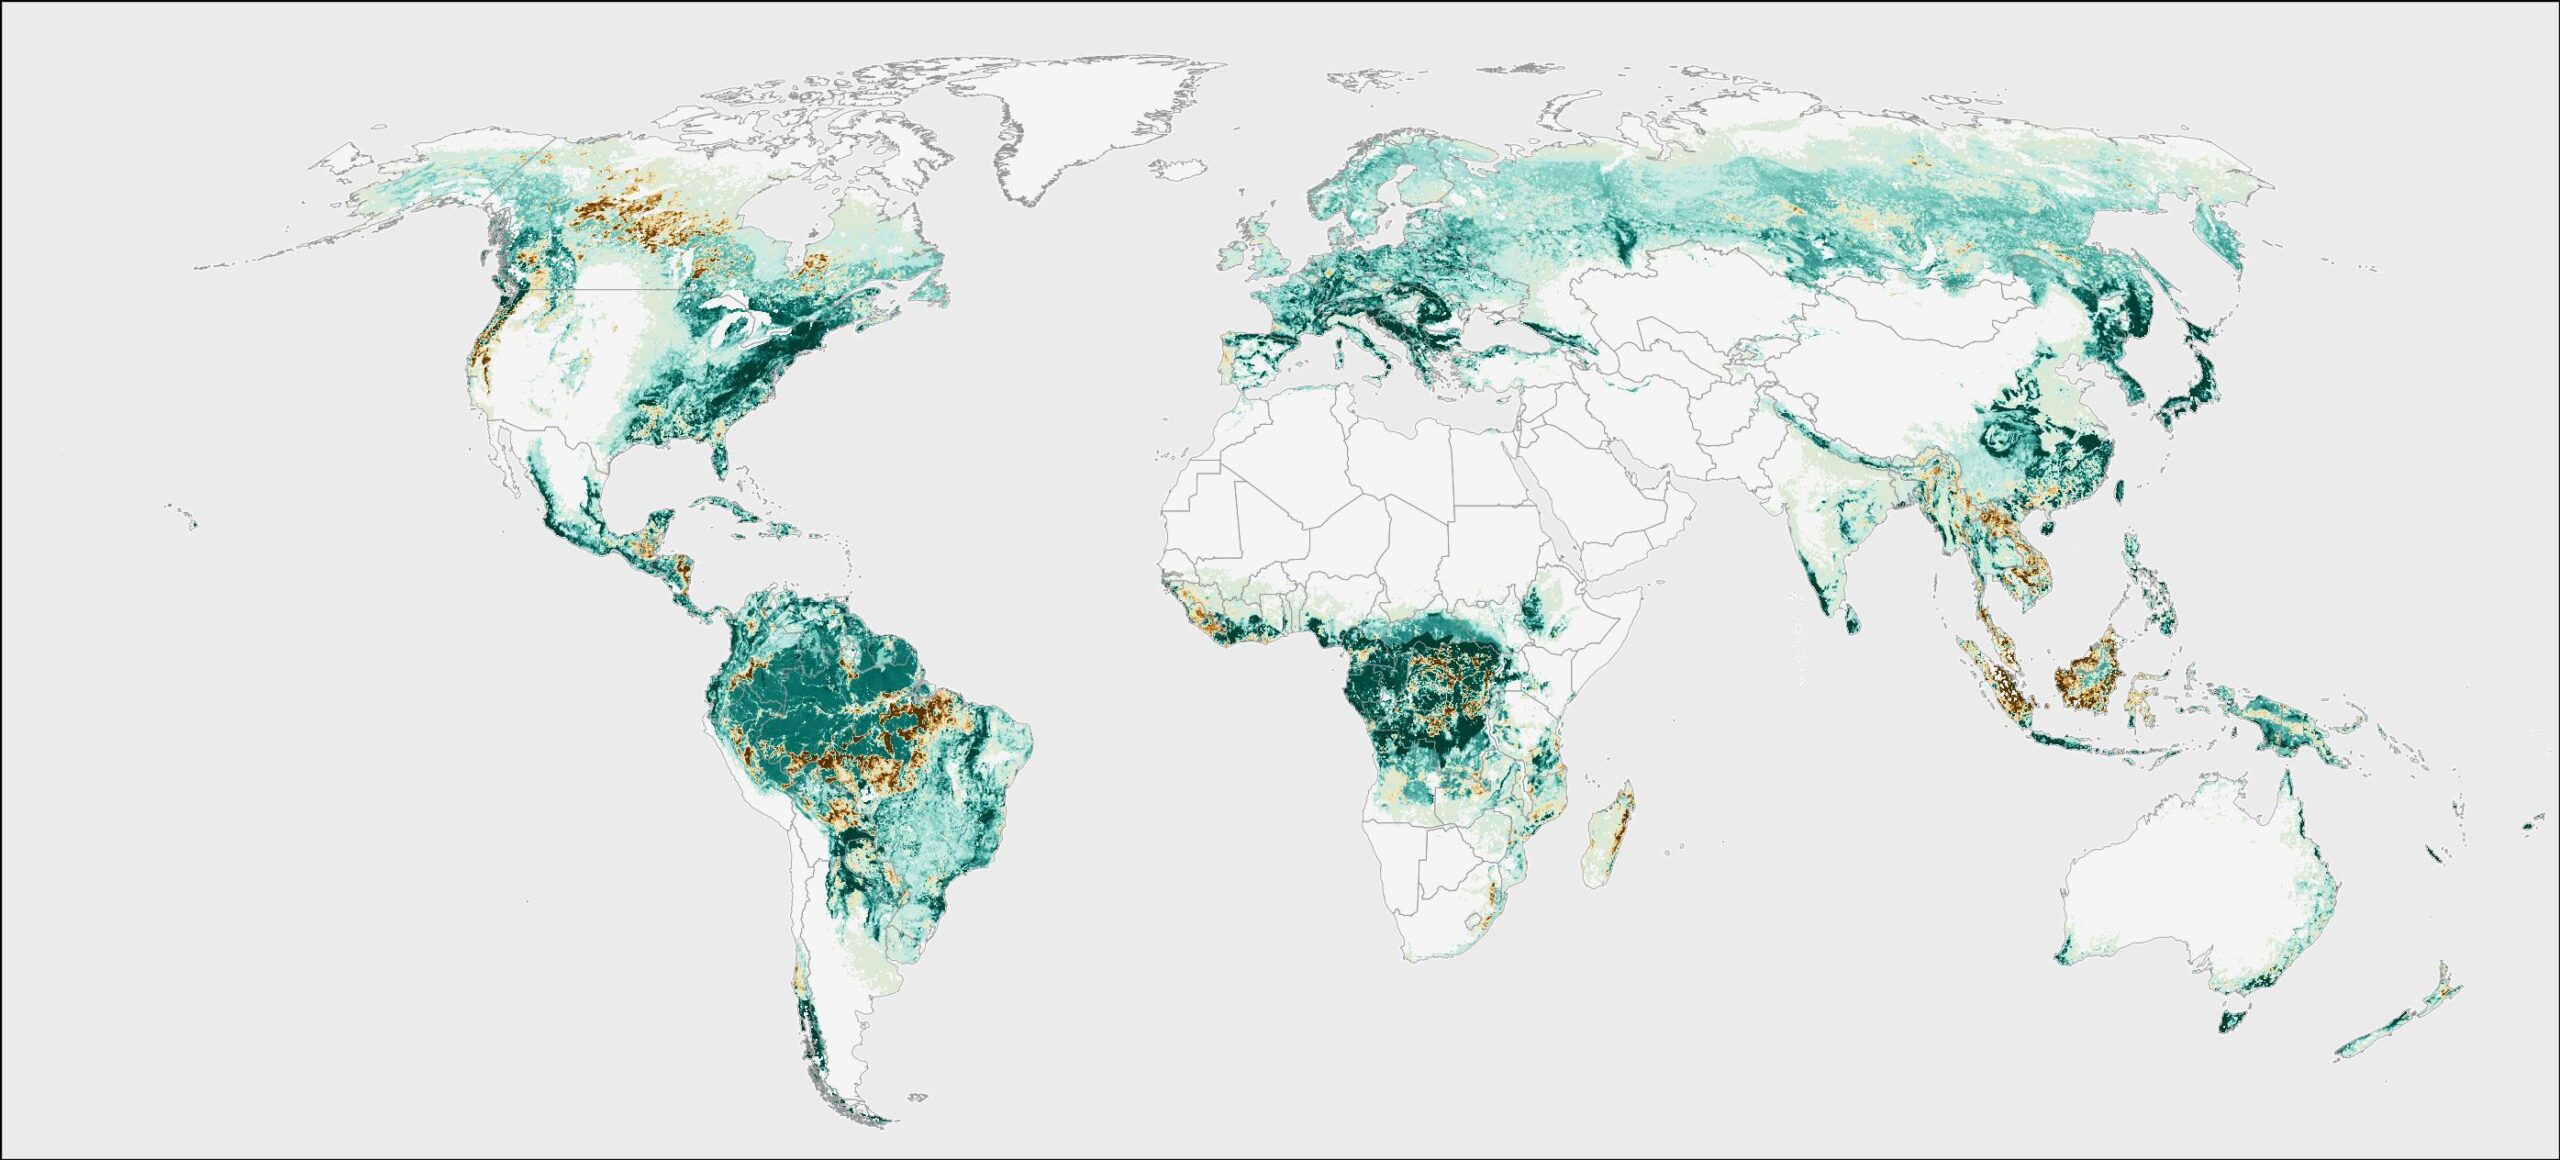
The tree cover loss data from UMD captures disturbances to tree cover — defined as woody vegetation at least five meters tall — at 30-meter resolution globally for the calendar years 2001-2025. This includes mortality or clearing of trees in primary and secondary natural forests, as well as in planted forests or tree crop plantations. In addition to global monitoring, in the tropics, we use humid tropical primary forest data as a baseline to look at loss only within mature natural tropical rainforest, excluding plantations, tree crops and young secondary forests — read more about why. Loss of tree cover can be due to human or natural causes and can be permanent or temporary. Read more about the tree cover loss data, including how it has improved over time, on the Global Forest Review.
What does the tree cover loss from fires data include and what’s new this year?
The UMD data also includes tree cover loss from fires, which distinguishes direct loss of tree canopy cover driven by fire from all other tree cover loss — read more about what the data covers. This data allows us to better understand how fire contributed to tree cover loss.
This year, the data shows fire-driven tropical primary forest losses decreased by 50% in 2025 compared to 2024, which had record-breaking fires across the tropics, particularly in Latin America. Fire-driven loss in 2025 includes some of the late season 2024 fires (e.g. those that occur November to December) which are often detected in the following year due to smoke that blocks satellite observations and delays detection of tree cover loss. Learn more about our findings from the 2025 data here.
How is tree cover loss different from deforestation and what does this mean for comparing with other monitoring systems?
Deforestation typically refers to a human-caused, long-term change from forest to another land use. Tree cover loss as defined in the UMD data includes both loss widely considered to be deforestation, such as conversion of a natural forest to agricultural land, as well as loss that is usually not considered deforestation, such as timber harvesting in plantation forests or natural disturbances — read more about the differences.
While tree cover loss does not directly measure deforestation, in some cases we use a proxy for deforestation, such as in the Deforestation and Restoration Targets Tracker on the Global Forest Review where we use data on drivers of tree cover loss to estimate how much loss is human-caused and long-lasting.
The differences between the definition of loss used by the UMD data and the definition used by other data sets is important to consider when comparing tree cover loss to forest change reported by other types of monitoring systems. Other common differences between data sets can include forest monitoring baselines, minimum areas measured, reporting periods and methods – learn more about these differences.
For example, the tree cover loss data is produced using satellite imagery and therefore monitors biophysical changes that can be discerned from this imagery. This can differ from official country definitions of “forest” and “forest change,” which often incorporate both biophysical and land use criteria. For example, the United Nations Food and Agriculture Organization (FAO) definition, which is sometimes used in country definitions, not only establishes minimum thresholds for the height, canopy cover and extent of trees, it also requires that land be officially or legally designated for a “forest use,” such as conservation or harvest — which is not directly observable in satellite imagery. Read more about the differences between FAO and GFW data.
Read on to explore how our tree cover loss estimates compare to several other estimates for 2025.
How does tree cover loss on GFW compare to other estimates?
Brazil – PRODES
PRODES — the official forest monitoring system for the Amazon from Brazil’s National Institute for Space Research (INPE) — and the UMD data have differences in their definitions and methodologies that are important to understand when comparing them. The deforestation rate reported by PRODES in the Legal Amazon only includes clear cut deforestation larger than 6.25 hectares (ha), whereas UMD captures any type of loss — both natural and human-caused — larger than 0.09 ha of all trees taller than five meters. These are both important measures that help us understand how forests are changing because deforestation, forest fires and small disturbances to forest canopy can all lead to impacts on climate, biodiversity and ecosystem services.
Another important difference is that the two data sets cover different observation periods. While PRODES includes the 12 months between August to July each year (the latest observation year being August 2024- July 2025), the UMD data includes the calendar year (January – December 2025).
Additionally, INPE has systems that specifically monitor and report fires (both within and outside forests). For example, INPE’s Queimadas Program monitors active fires and burned areas. INPE’s DETER alerts — which track deforestation and degradation on a daily basis — separate alerts related to wildfires from other forms of degradation and from deforestation.
To compare the two data sets, we took a few steps to account for their differences. First, we separated fire from non-fire primary forest loss in the UMD data, since PRODES does not include the type of fire-driven loss captured by the UMD data. Both monitoring systems show a decline between 2024 and 2025 in the Brazilian Amazon — a 41% decline in non-fire primary forest loss from UMD, and a 12% decline in deforestation from PRODES.
Second, to account for the 6.25-ha minimum mapping unit used by PRODES, we applied a 6.25-ha minimum mapping unit to the UMD annual non-fire primary forest loss to separate loss areas into patches smaller than 6.25 ha, and greater than or equal to 6.25 ha. When accounting for patch size, the UMD non-fire primary forest losses greater than or equal to 6.25 ha declined by 39%, and non-fire primary forest loss patches smaller than 6.25 ha declined by 43%.
Brazil – MapBiomas
MapBiomas Brazil is a network of NGOs, universities and technology startups that develop annual maps of land cover and land use, as well as various monthly monitoring and alert products. Since 2019, they have produced annual reports on deforestation in Brazil through an initiative called MapBiomas Alerta. The data is produced by combining deforestation alert data from various independent (e.g., SAD) and official (e.g., DETER and PRODES) monitoring systems and then validating and refining the spatial boundaries of these alerts through visual inspection of high-resolution satellite imagery.
MapBiomas Alerta and the UMD data have important differences in definitions and methodologies that affect how they measure forest loss in Brazil. The MapBiomas data focuses only on the complete removal of native vegetation (including forests, savannas and grasslands) and excludes losses from fire, selective logging, shifting cultivation and other forms of partial disturbance; whereas the UMD data includes all types of tree cover loss greater than 0.09 ha regardless of driver, including both natural and human-caused events, and detects complete as well as partial losses where at least half of the canopy cover within a 30-m pixel was cleared. Additionally, UMD uses a fully automated algorithm to detect change, while MapBiomas visually verifies and refines alerts from various systems that use different detection methods.
To account for these differences before comparing the two data sets, we used a 10% canopy density threshold as the baseline for calculating tree cover loss — rather than the 30% threshold we typically use for most countries in our analysis — to account for losses in Brazil’s sparsely treed ecosystems, which are included in the MapBiomas data. We used the natural vegetation classes in the MapBiomas Brazil 2018 land cover map (collection 10) as the baseline for the analysis. We also separated fire from non-fire loss in the UMD data, since, similar to PRODES, MapBiomas Alerta does not include the type of fire-driven loss captured by the UMD data.
The UMD non-fire loss shows similar trends as the MapBiomas Alerta data from 2019-2025. MapBiomas Alerta showed a 30% decline in deforestation between 2024 and 2025, similar to the 25% decline in UMD non-fire loss. Although the UMD data show a higher overall amount of non-fire loss over the period, this is likely due to the inclusion of selective logging, shifting cultivation and other types of losses (including partial loss) not included in MapBiomas Alerta.
Colombia – SMByC
Colombia’s Forest and Carbon Monitoring System (SMByC), the official forest monitoring system led by the Institute of Hydrology, Meteorology, and Environmental Studies (IDEAM), produces official annual deforestation statistics, typically released in July every year, as well as quarterly bulletins that provide information on early detection of deforestation, with a particular focus on the Colombian Amazon. SMByC monitors changes to natural forests, which include primary and secondary forest but excludes plantations forests and trees planted for agricultural production, and defines deforestation as any type of conversion of forests to other land cover. The official annual deforestation statistics are produced by using algorithms to detect change with satellite imagery, which is then visually assessed and refined through various quality control steps.
Although the official deforestation statistics for 2025 have not been released by IDEAM yet, the SMByC has released initial deforestation estimates for 2025 for the departments in the Amazon based on the early deforestation detection system. These initial estimates report 72,000 ha of deforestation in the Amazon, slightly higher than UMD primary forest loss in these regions (68,000 ha). However, these estimates may be revised once the official deforestation statistics are released later this year. Generally, UMD primary forest loss and SMByC official annual deforestation statistics show similar trends and area of forest loss in the Amazon in recent years. Differences in the two data sets for certain years may be due to differences in the timing of detection of late-season loss events between the two systems, as well as differences in methods, such as the algorithms used to detect change as well as SMByC’s natural forest baseline.
Indonesia – SIMONTANA
Official deforestation data provided by the Indonesian Ministry of Forestry through the National Forest Monitoring System (SIMONTANA) has not been published yet for 2025, but information on this monitoring system and how it compares to UMD data can be found here.
Indonesia – Auriga Nusantara
Auriga Nusantara is an environmental non-profit in Indonesia that monitors changes to forest cover in Indonesia and coordinates the MapBiomas initiative for the country. It monitors and reports the loss of natural forest cover, which includes primary and secondary forests but excludes timber plantations and plantation forests.
The data is produced by first identifying suspected forest loss using UMD deforestation alerts within the MapBiomas natural forest cover extent, creating larger bounding boxes surrounding alerts, and running a deep learning model using 10-m Sentinel-2 satellite imagery within the bounding boxes to detect the extent of forest loss. Visual inspection of areas greater than 1 ha is conducted to verify if forest loss occurred and remove errors. The data includes forest loss greater than 0.25 hectares.
Since 2025, Auriga has implemented new methods for forest monitoring that better capture annual forest disturbances. Moreover, Auriga uses a natural forest baseline for their analysis that is updated every year to capture primary and regenerating secondary forests. To better account for the difference in baselines, we took additional steps before comparing the data sets. We used the natural forest vegetation classes in the MapBiomas Indonesia 2022 land cover map (collection 3) as the baseline and included all tree cover loss (with no canopy density threshold applied) to capture potential loss in regrowing secondary forests. We also applied a 0.25-ha minimum mapping unit to the UMD tree cover loss data. Finally, we used the UMD humid tropical primary forest data to separate primary from secondary forest within the MapBiomas natural forest extent.
Within all natural forest (both primary and secondary), the total UMD tree cover loss for 2025 (accounting for the 0.25 ha minimum mapping unit) was 410,000 hectares, which is similar to the amount of forest loss reported by Auriga (434,000 hectares). The increase between 2024 and 2025 was 17% for primary forests and 20% for secondary forests.
Including secondary forests and accounting for the 0.25 ha minimum mapping unit shows a closer alignment between the two data sets. Further differences in the results are likely due to Auriga Nusantara’s methodology updates, use of an annually updated baseline and other differences in methods, which include different input satellite imagery and spatial resolution.
JRC Tropical Moist Forest
The Tropical Moist Forest (TMF) data set by the European Commission Joint Research Center (JRC) monitors forest change in the tropics. Like the UMD tree cover loss data, the JRC TMF data uses Landsat imagery to map forest disturbances annually at the 30-meter pixel scale. However, there are some key differences between the data sets — read our in-depth comparison here.
In general, the JRC TMF data detects a larger area of disturbances than the UMD tropical primary forest loss data because its degradation class includes disturbances that do not meet the definition of loss used in the UMD data, such as clearing of less than half of the tree cover in a 30-meter pixel or disturbances detected over a very short period.
Both the JRC TMF data and the UMD tropical primary forest loss data show similar trends in recent years, with both data sets showing a decline in disturbances between 2024 and 2025: JRC TMF data show a 45% decline in disturbances across the tropics, similar to the 36% decline in the UMD primary forest loss. After removing UMD tropical primary forest loss due to fires, since fires are classified as forest degradation in the JRC TMF data, the UMD non-fire primary forest loss estimate in 2025 was very similar to the JRC TMF total deforestation estimate — both approximately 2.7 million hectares. It’s important to note, however, that the distinction between JRC TMF’s degradation and deforestation data for 2024 is not yet fully consolidated because insufficient time has passed to confirm post-disturbance forest recovery or disturbance permanence.
These monitoring systems provide complementary information which — when understanding the definitions, scope and methods of each system and evaluating them together — can offer a nuanced and holistic view of how forests are changing.
Read our full analysis of the 2025 tree cover loss data on the Global Forest Review.